

Resource usage
Open Usage & metrics in the sidebar (or / then “usage”). Four cards show your latest sampled CPU, memory, disk and network transfer against your plan's allocation, and the 30-day trend chart underneath plots CPU and RAM so you can spot growth before it's a problem.
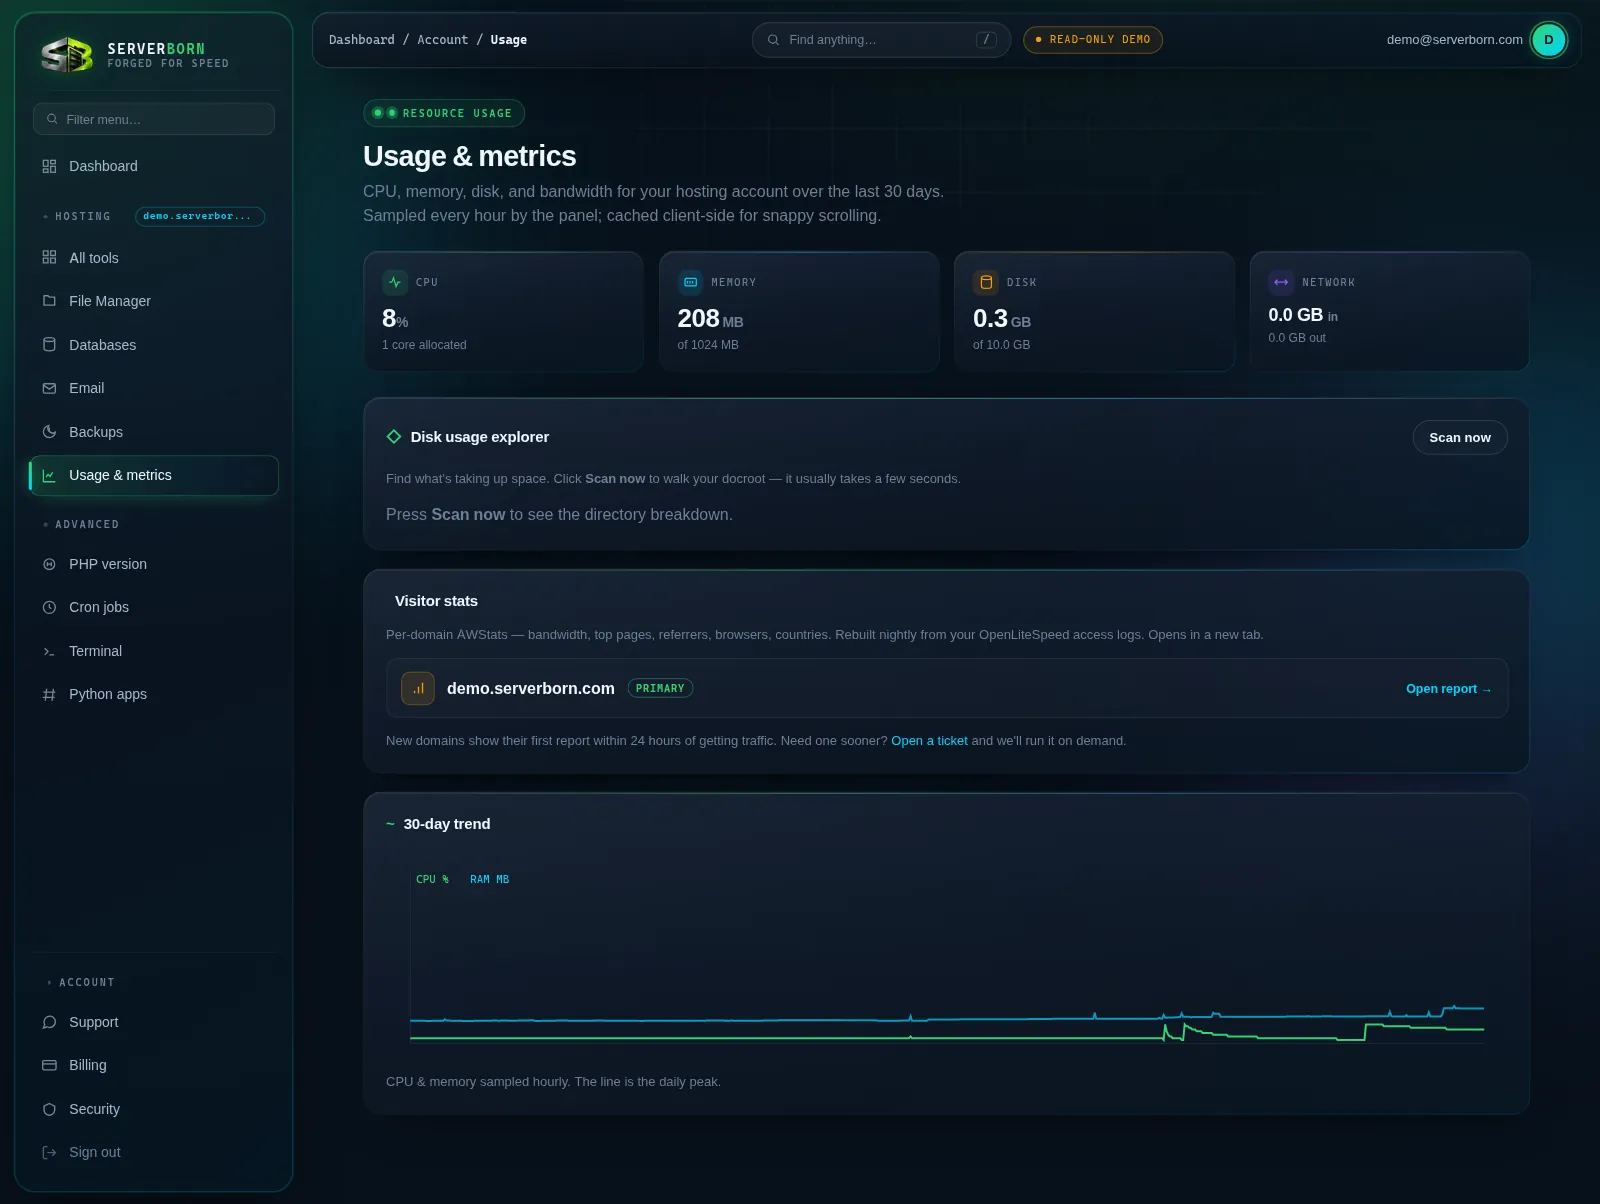
Find what's eating your disk
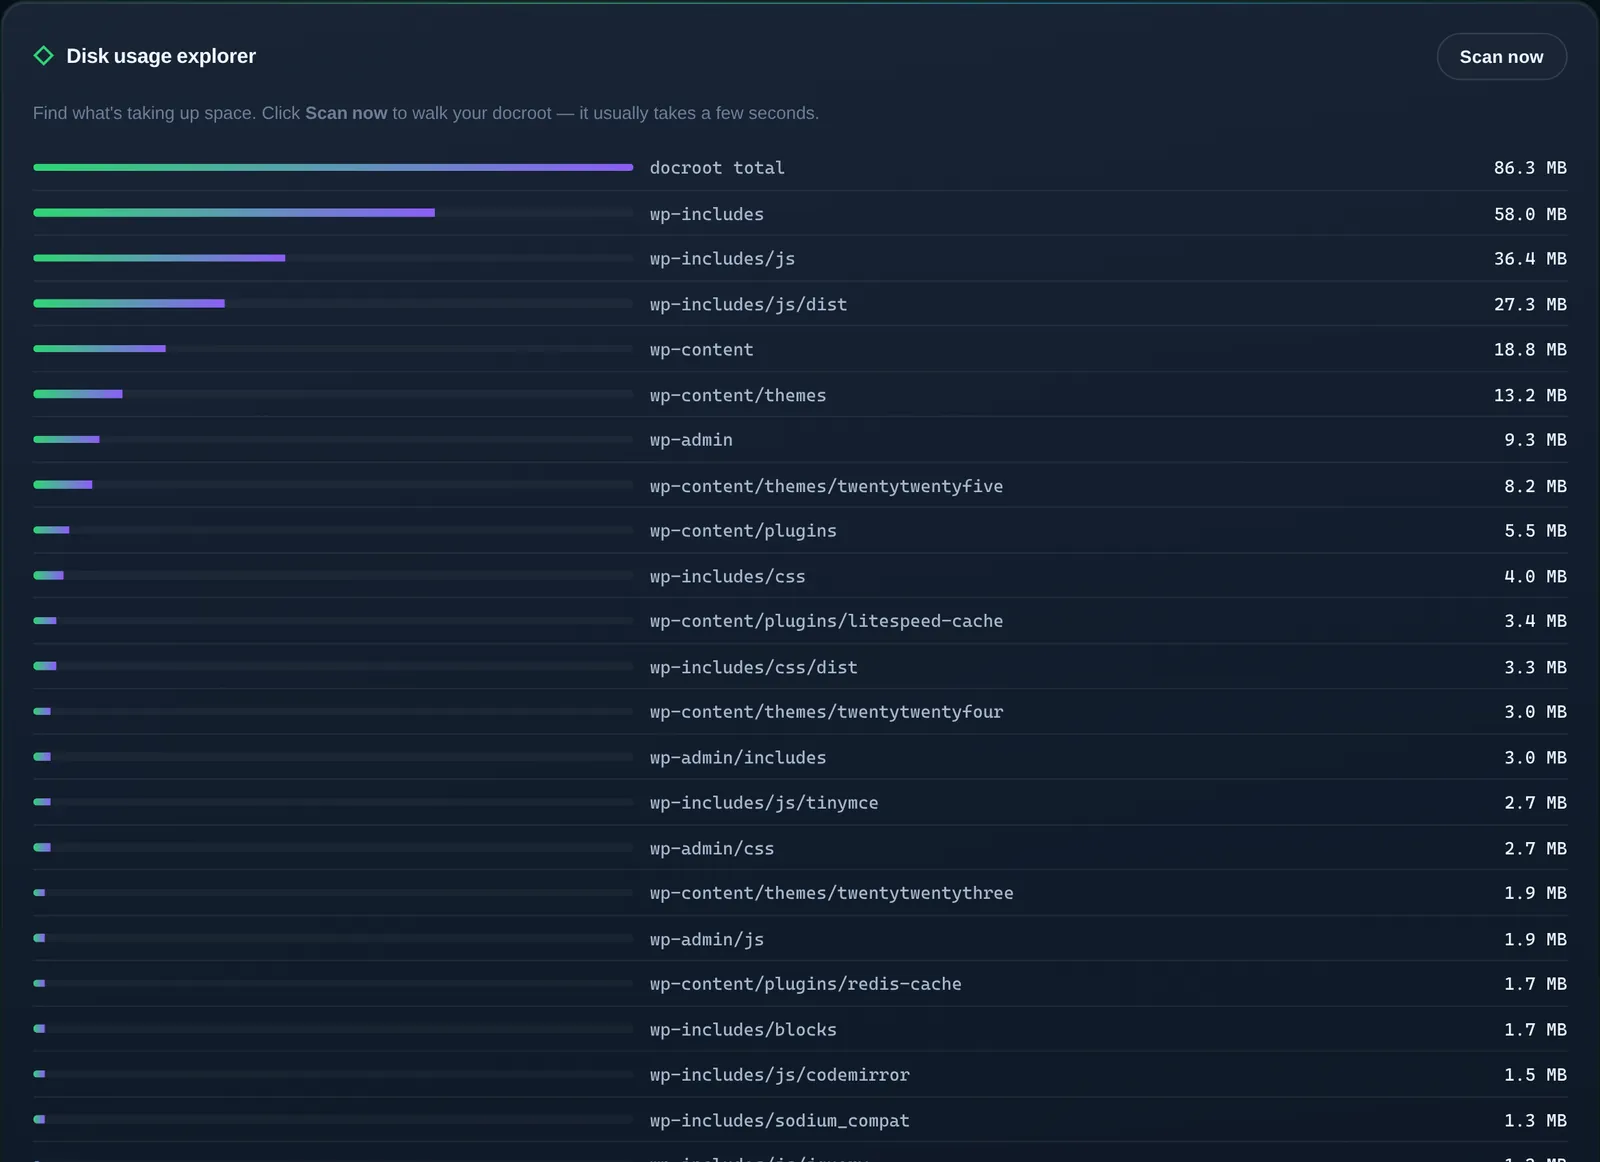
- On the Usage page, click Scan now
In the Disk usage explorer panel. The scan walks your files: a few seconds for a typical site.
- Read the bars
Every folder gets a bar scaled to its size, biggest first. An overweight
wp-content/uploadsor a forgottenbackup-old.zipshows up instantly. - Act on it
Jump to the file manager to delete what you don't need. The disk meter on your dashboard updates within the hour.
Server log reports
For real visitor numbers (who visits, from where, on which pages), use Analytics: it counts the visits served from the Cloudflare cache that server logs never see, with no cookies. The log report below is best for bandwidth, bots and error pages.
- Open the server log report
The Server log reports card at the bottom of Usage & metrics, the Server log report tiles on your account's All tools page, or the link at the bottom of the Analytics page.
- Pick the domain
One card per domain: click Open report →.
- Explore the report
Visits, bandwidth, top pages, referrers, search engines, countries, browsers, rebuilt nightly from your real server logs, no tracking script on your visitors.

New domains show their first report within 24 hours of getting traffic. Need one refreshed sooner? Open a ticket: we can rebuild on demand.
Do the stats need a cookie banner?
The reports come from server logs, not a tracking script, so nothing runs in your visitors' browsers and no cookies are set for analytics.
Why does my disk number differ from the explorer total?
The plan meter counts everything (all sites + databases); the explorer scans one site's files. Databases live outside the file tree.